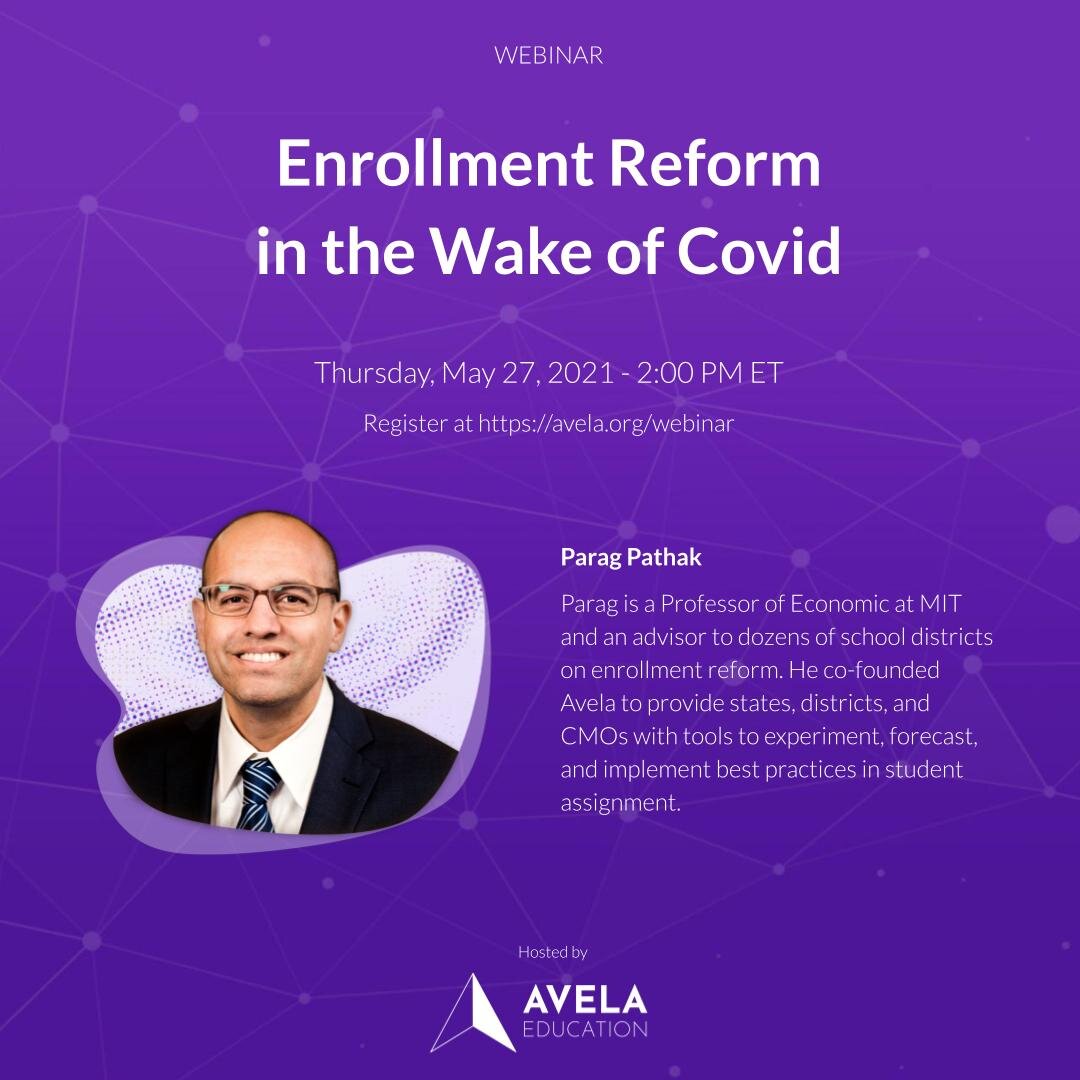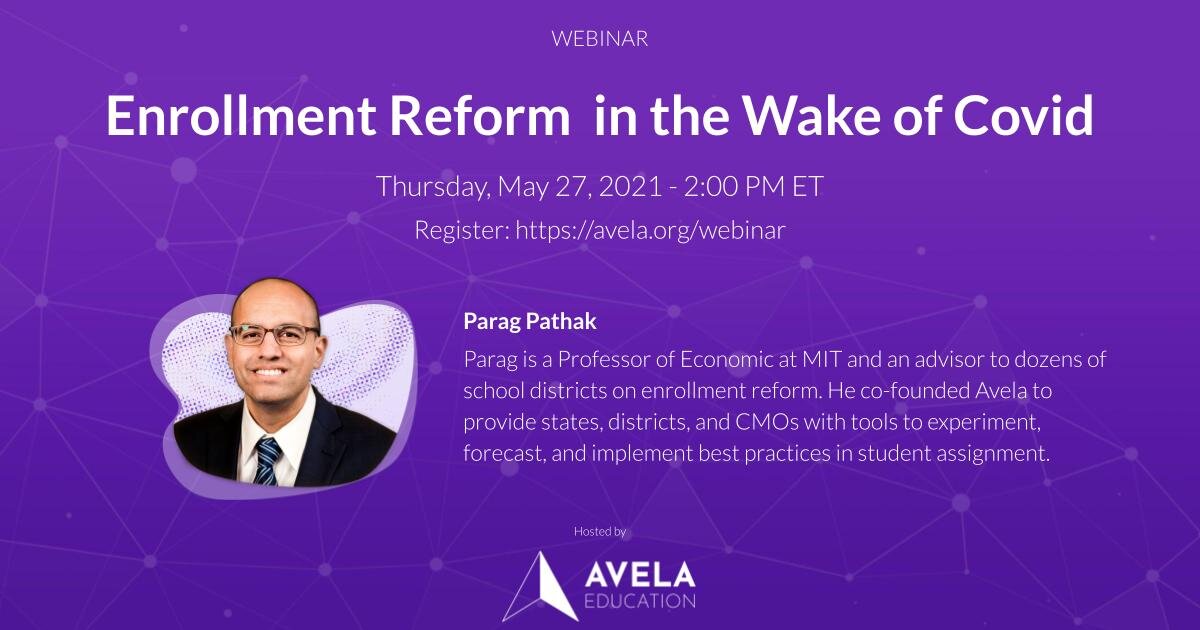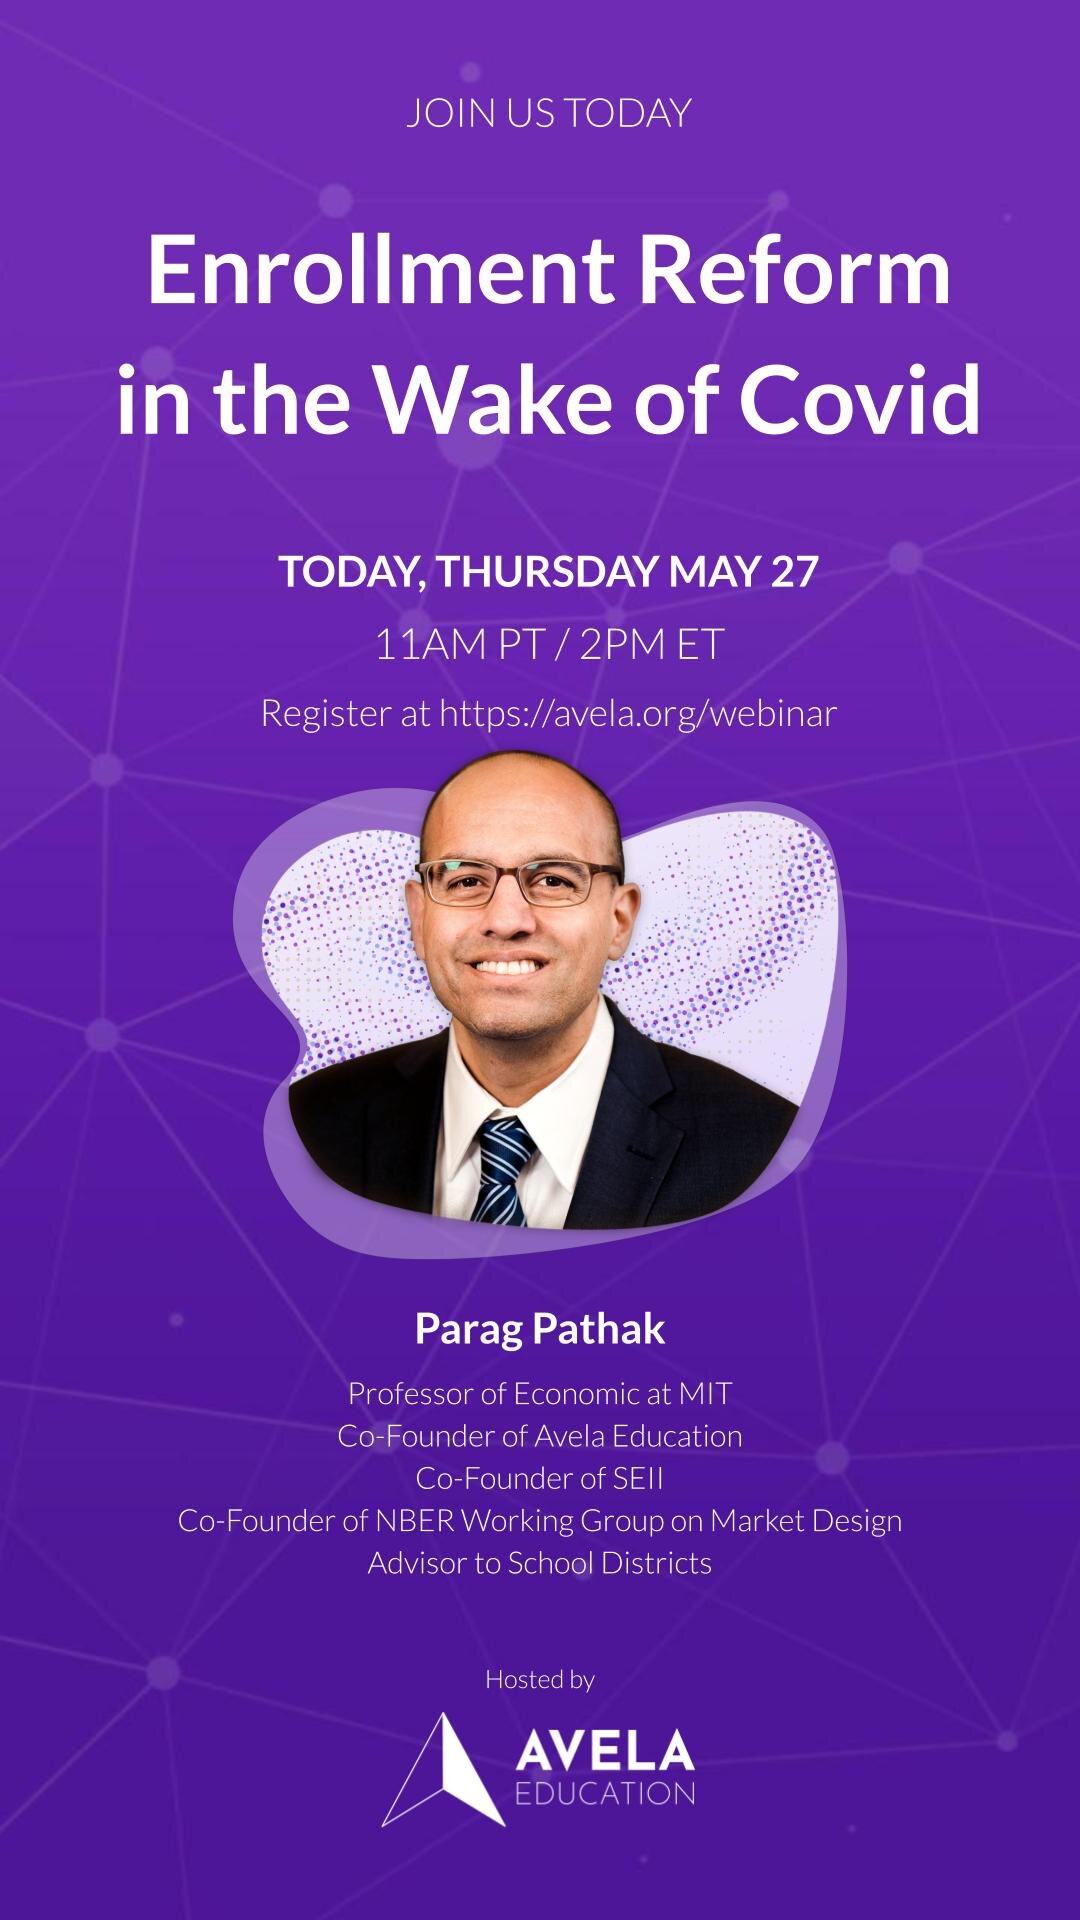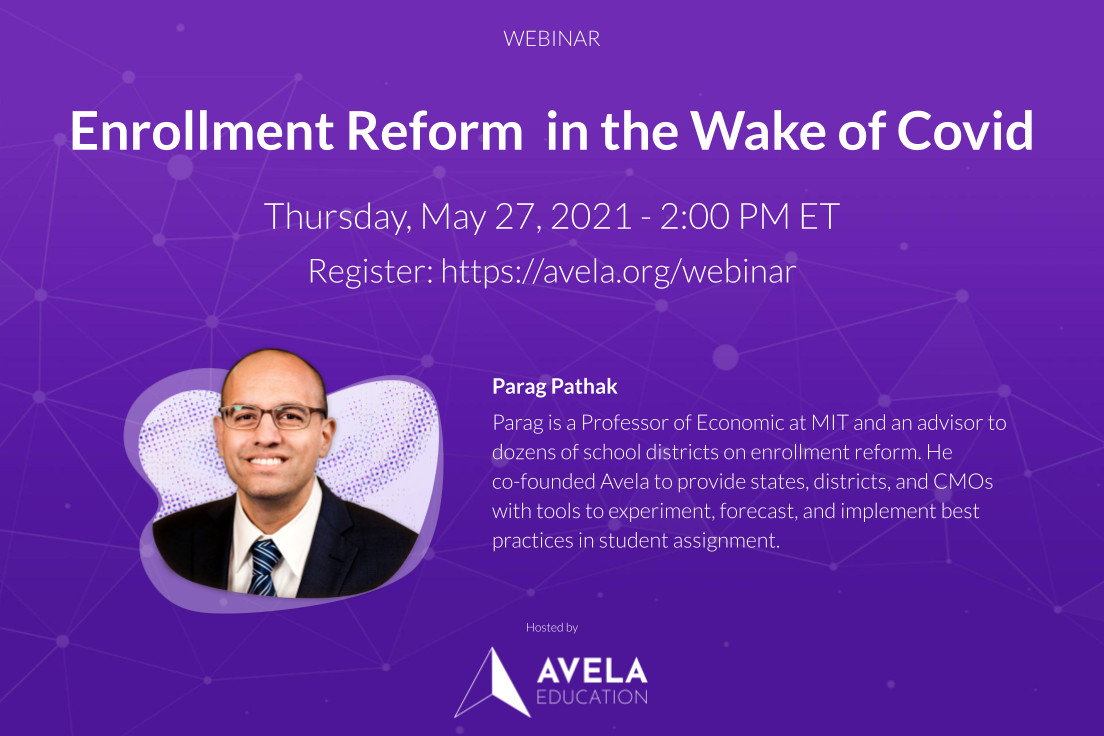
Enrollment Reform After Covid (Webinar)
Recorded Live: Thursday, May 27, 2021 - 11:00am PT
MIT Professor and Avela Co-Founder Parag Pathak shared the current evolution of enrollment reform in the wake of Covid-19, with a lens on social equity and descreening. The webinar opened with an introduction on Avela Education and the speaker, Parag Pathak. Parag then discussed the disruption to schools caused by COVID-19 and the latest trends in school enrollment and attendance. The bulk of the discussion focused on the opportunities for reform that this disruption has caused, including several efforts underway by school districts in New York, Boston, San Francisco, and others.
Live Video Recording
Slides
Summary
The COVID-19 pandemic has shocked the education system. Whether it be school administrators, students or parents, everyone is affected by this unprecedented event. In this webinar, Parag discusses how the pandemic affected student performance and school enrollment. Parag also discusses the recent attempts to design a more equitable education system.
The pandemic is not only causing learning loss but is also increasing educational disparity. A recent randomized trial at West Point showed how remote learning decreased academic performance, and Opportunity Insights showed that low income students experienced more learning loss than their higher income peers. The Opportunity Insights study also showed that this disparity might be permanent; the drop in academic engagement lasted long past the initial shock.
On the school side, districts are experiencing a significant decrease in early education enrollment. This is especially problematic as elementary schools are particularly vulnerable to funding shocks due to their small enrollment size. Even as the pandemic (hopefully) ends, the return to schools might be slow; parents are hesitant to send their children to school, and public schools don’t have a lot of funding to create a safe return. A recent $130 billion boost to K-12 should help schools produce a safe return, and local schools are creating innovative methods of bringing students to the classroom.
With large disruptions to the national school system, there have also been increased cries for equity in the education system. In order to increase representation, top Boston and Chicago public schools included students’ home neighborhoods in admissions. Even with the best intentions, reforming allocation systems can be challenging. For example, Parag found that Chicago Public Schools could increase the minority share at their top school by 50% without changing the average test score at these schools. With the help of market design experts, such as Parag, school systems can ensure that their goals are fully achieved. New York City, San Francisco, and North Virginia are just a few more districts that are attempting to improve their allocation system, and the state universities of California, Colorado, Oregon, and Washington are reconsidering how test scores should factor into admissions.
Transcript
Speaker 1 - Greg Bybee
Hello and welcome to today's webinar on enrollment reform in the wake of COVID-19 with Parag Pathak. My name is Greg Bybee and I'm the CEO and Co-Founder of Avela. I'll kick us off with a quick introduction on Avela and then pass it over to our speaker. He'll talk about COVID induced disruption, the enrollment trends that we're seeing and what opportunities this brings for reform. We'll leave time at the end for Q&A and discussion - but please jump in throughout to ask questions - we'll have a great conversation!
This webinar is sponsored by Avela. We understand that assigning students to schools is very complicated. Enrollment reform is hard. There's a lot of preferences on the family side and the student side, as well as policy goals, school requirements, eligibility and so forth. Avela has built a tool that can take all those preferences in - whether rankings, weightings, priorities, walk zones, tiebreakers, eligibility requirements, screens, and more - and we take all of that and play that game of Tetris and Dominoes to find the optimal allocation of students into schools.
This can be used for the final enrollment lottery to assign students in the schools. It can also be used for simulations for forecasting, policy discussions, and so on. We offer both (1) software to run these enrollment lotteries, as well as (2) a matching engine that can integrate into your existing tools. If you already have an enrollment system, we could be the lottery piece of that. And then we also offer (3) a range of consulting and advisory services.
We think a lot of effort spent on enrollment is very inefficient - we can do it much faster, running these scenarios in a matter of seconds to save school districts a lot of time and money. Most importantly, [we can] enable a much more equitable outcome in enrollment by eliminating implicit bias and privilege that can be baked into enrollment lotteries. This makes it more fair and equitable, and, in turn, more empowering for families. If it's an opaque process or confusing and not honorable, that reduces trust and agency. And so we want to make it easy, auditable, transparent and equitable.
We do this with Nobel Prize winning algorithms on the back end, pioneered by a number of our colleagues and peers, including Al Roth. We've got a fantastic team of matchmaking experts who founded Avela, in particular Josh Angrist, and Parag Pathak, were both professors of economics at MIT.
And that's a perfect segue - one of those experts is leading today's webinar! And so with that, I'm pleased to introduce Parag Pathak. He's my co-founder of Avela and our Chief Economist. He's a Professor of Economics at MIT, one of the co-founders of the MIT school effectiveness and inequality initiative SEII, as well as a co-founder of the NBR Working Group on Market Design. He's also an adviser to dozens of school districts on enrollment reform, as well as nonprofits on lottery design and market design, and even the military. And he's the John Bates Clark medal recipient. So with that, let me turn it over to Parag.
Speaker 2 - Parag Pathak
Great. Hello, everyone. Thank you so much, Greg, for that introduction. And thanks, also to Avela for sponsoring today's webinar. I'm really excited about the opportunity to bring us together and share with you what I've been seeing and hearing from folks. we're managing enrollment and assignment processes this year. As we approach the end of the school year, we thought it would be a good time to have this event. And it's been a tough year. It's been a tough year for everyone. But the bright side is there's been a lot of innovation and reform, the disruptions caused by COVID-19. And a growing urgency over concerns about social justice have created an opportunity to challenge and revisit thinking on school enrollment policy.
Before I get into the meat of today's presentation, I'm also interested in learning from you. And I would love to start off by launching a zoom poll and asking if you could tell me who you are. So on your screen, I hope you see a question it says what's your role? Please click an answer and I'll tell you who else is joining us today.
Great Okay, so we have our poll results. Thanks so much for filling this out. We have a good mix of participants online today, the largest group is the district enrollment, folks, thanks so much for joining. We have other district administrators, teachers, philanthropists, and funders, Policy Advocates, and other folks. So thanks very much for filling that out. That's a very useful context. And I want to kick things off in my talk today by telling you a little bit about the landscape of K-12. Education and the last year or so and what we are seeing and hearing from our friends in the field and what we're also learning from a very early academic research literature on COVID induced disruption.
So it goes without saying that over the last 14 months or so, district leaders, school operators have spent a lot of time on operations, managing uncertainty associated with COVID. And thinking about questions about how to best utilize school facilities. How would we know if we are socially distancing appropriately? What happens to bus transportation in an era of social distancing? Or how should we structure COVID? testing? Should it be pooled? Which vendors should we use? How should we reallocate the budget for all of these new instructional models that we're experimenting with and this associated staff time? Other questions we hear from our friends are, you know, questions about how much choice should families have over educational models. And here on this slide, I have a clip from our friends from the local public school district in Massachusetts. And Lowell is one of the few districts out there that actually asked parents what educational model that they'd like. And the article says some have gotten creative. Lowell decided to actually conduct a weighted lottery for in person slots. So they add more demand for in person instruction, then capacity according to the rules. So they ran a lottery to bring some families back to class.
And then finally, the challenging question of how best to communicate with this tremendous uncertainty with parents over the last year. So now, on the student side, I think one emerging theme that we're seeing is that COVID-19 has made existing inequalities in K-12 education more apparent. So many of us know that in K-12, families that have advantages. families that have wealth, have long been able to obtain their preferred educational offerings for their kids. This is, you know, done historically, through choosing where to live residential choice, opting safer private schools, or in cities that have choice systems, navigating those systems with skill. But now in the last year, choice options have expanded to include things like fully remote instruction, hybrid instruction, in person instruction with social distancing online tutoring, pods, and the early evidence is starting to tell us what we're what we should expect on the effects of these kinds of choices on educational inequality. So let me show you an exhibit that I've extracted from a new paper by Andrew Baker Hicks, Josh Goodman, and Chris mulhern. And what these researchers do is quite creative. They get access to Google search queries, and they tabulate the difference between high and low SES families in queries for resources on online learning. So prior to March 1 2020, there's relatively little difference between these two groups. But right after March 2020, there is a huge increase in search behavior online, between high SES families and low SES families upwards of a 50% difference. So this is one manifestation of the idea that high SES families are more effectively able to navigate the disruption created by the pandemic. Another fact that we're seeing is data from the group at Harvard opportunity insights, which has been collecting information from a leading edtech provider zurn zurn, runs an online math platform. That's something that's typically used in combination with hands-on instruction, and they've been very friendly with researcher groups. And what I'm showing you here is a percentage change in engagement with the zurn math platform.
And just like the previous figure, once March 2020 hit, what we see is a dramatic precipitous fall in interaction with this online platform. And that fall has not recovered. So even as of May of this year, there's still about a 20% decline in using the zoom platform. And that decline also splits on FCS lines. Here, I'm showing the similar measures of engagement with the zurn platform between high income and low income schools. And both groups at the beginning of the pandemic and march 2020 experienced this drop. But the recovery is much better for the high income schools and the low income schools. As of May, there's still a 22% decline in certain participation for low income schools relative to a 10% decline for high income schools.
Now, the last thing I want to show you about this is some new evidence that was just released last week on learning loss. Now, this is something that's very hard for us to measure. In many places, this school year is still ongoing. But some researchers have put together a very creative study at West Point, okay, where they took students who are required to take an introductory economics, and they randomly assigned some to either online instruction, or to in person instruction. And what I'm showing you in this figure is the difference in learning between those who are online versus those who are in person. So each point here reflects a way of measuring learning. And you'll notice that every point here is less than zero, which means that online learning has a negative effect on the final grade that students received about a point two standard deviation reduction in final grades, performance on problem sets, homework exams, midterm performance, and the effects are largest for the academically at risk students. So the researchers go on to survey online students and not surprisingly, students have, you know, report struggling to concentrate in class and feeling less connected. So this is a bit of the landscape that we're in, in this last year. And it raises the following questions that a lot of our district partners are wrestling with right now.
One question is, what role will there be for online or hybrid instruction in Fall 2021? Okay, so just a couple of days ago, New York City announced that there would be no remote and hybrid options. The goal is to have everyone in person in school, whereas other districts like Houston in Philadelphia, and some districts in California, still plan to offer remote options. In Indianapolis, what we're hearing is that students who want remote options will be referred to virtual charter schools that are operating already in the Indianapolis district. So how will families react to this pattern? Will some families demand flexibility in districts that do not offer it? And how do we ensure that some families are not left out? Now, another thing that we're paying a lot of attention to is now that we've spent this year experimenting with different facilities arrangements, different models of education delivery, will this finally be the catalyst that leads to a greater experimental mindset and how we provide K-12 education. So I can speak from experience, I've had to log into 20 different apps for my children who were in remote instruction. But you know, I've paid that fixed cost. And I think many families have now become more familiar with what types of products are out there. But what we don't know is much about the quality of the various product offerings. And there's very few high quality studies on what types of apps and products work best. And there's lots of room, I think, for us to learn more and ensure that there are high quality options even if they're provided in an online format. So let me now turn to enrollment trends and what we're hearing from our friends who are managing districts and also from the States. You know, the uncertainty created by COVID-19, I think was an important motivator instigator of choice.
So that's come in many different ways, families opting for private schools, those deciding to homeschool their children, those delaying elementary school entry and those leaving urban areas all together. And the numbers are still quite preliminary. But some of the numbers that I've seen out there are a survey for Fall Enrollment of a 2% overall drop in public school enrollment. There's evidence that most of that drop is coming from the early grades. So another survey that NPR conducted, reported that kindergarten enrollment in the fall dropped by 16%. Looking across 60 districts in 20 states. And you might ask, how does this fall across income and racial lines and what we're seeing so far, and I should emphasize, all of this is very preliminary, okay, we're just coming out of a, you know, a year of incredible uncertainty. And our ability to measure this stuff is quite, quite preliminary. But so far, it appears that there's no consistent pattern across income and racial lines. And, you know, there's lots of potential explanations for that. One could be that some low income families are avoiding online kindergarten and online pre K, whereas high income families are choosing to enroll in private options.
So let me pause here since we have so many folks from district enrollment offices online here. I want to issue another poll, and we can share kind of thoughts on enrollment. And I'm going to ask what you guys are seeing. So there's a new poll question launched for those of you who are in a district. We're very curious, what did you see in the most recent enrollment season? So please take a moment to fill that out.
And some folks are chatting me that total enrollment is down 10%, kindergarten enrollment is down 20%. The poll results here show about a third of participants are reporting a slight decline 5% or less 28% are reporting a medium decline six to 15%. And then there's one participant who says a large decline of 15% or more. Now if we look at some of the other facts that we know about this, we've collected information from several newspaper accounts, and we'll circulate these slides later if you're interested in how we got this information. But looking at urban districts, we see you know, pretty consistent with the overall picture, declines in enrollment between two and 4%, San Francisco reported a 2% decline. Boston reported a 4.3% decline, New York City's right in the middle at about 4%. And in all of these places, what we're hearing is that there is a market decline in K and pre k enrollment. So in New York, K, enrollment is reported to be down by 9%. And pre k enrollment is down by 13%. And so part of I think what's driving this pattern is that COVID has led families to leave urban areas, especially if some families are able to work remotely. There's also a longer term trend that is underneath these patterns, which is driven by the demographic patterns, a decline in birth rates and the increasing cost of city living.
And another thing that we're hearing from our friends is that some of these enrollment declines are most devastating for small schools, small schools like elementary schools where losing a big chunk of kids makes the school's pretty financially vulnerable.
So when we think about what needs to be done a couple of thoughts about the coming school year and the summer, you know, districts I think will have to work extra hard to lure families back left. Now, many will be wary of another transition between an educational model and the ongoing concerns about childhood vaccination and you know, various COVID variants. And so what is the best strategy to regain trust in families and attract people's back after euro of uncertainty. You know, we're hearing from some friends that they're having open houses or school showcases. During the summer, other districts are experimenting with lots of outreach for summer school programming. And those seem to be some of the main ways that families are getting back into districts and starting to think about whether they want to transition back. Now, if these enrollment declines persist, we have to face the question of what impact will this have on school budgets and resource allocation over the longer term.
And here, we have an opportunity with the COVID 19 relief in the federal stimulus plan. You know, the best estimates that I've seen is that the plan amounts to about $2,500 for each school child to be spent over the next two and a half years. So the districts that we talked to many of them are asking, Well, this is a short term financial boost. How should we spend it districts ? You know, you may need to focus on short term objectives, because there's no guarantee that this additional funding will continue behind too, and beyond two and a half years. So that's something I would love to hear from some of our district partners, what they're thinking about and what they may do with these funds, and how to combat this decline in enrollment.
Kind of a third implication from the decline in enrollment is related to some research work that we've been doing at MIT about pre K. So there's a growing consensus in the academic literature on the long term value of early childhood education. We just released a study looking at the long term effects of getting into pre K and Boston, the effects on going to college and graduating high school. And what we find is that pre k actually has a pretty impressive effect on these long term outcomes. How do we think about that when we just talked about the large decline in enrollment at pre K and kindergarten, and what I'm very worried about is that we are missing out on these early years, and these early years tend to be quite valuable. So we should expect that there will be long term consequences on educational attainment from the decline in enrollment at kindergarten and pre K.
So that's on the enrollment side. Now, let me turn to some of the innovative things that we've seen districts do in this past year on the reform side with admissions and enrollment. Now, in many ways this year has presented challenges and opportunities. The challenge, which became an opportunity for several districts, is what happened in spring 2020. So COVID made it very difficult to have standardized tests in spring of 2020. So in school districts that use tests to admit pupils, they didn't have access to the historical measures. So that's kind of Fact number one. Fact number two is a brewing, long run concern that many of the district's most sought after schools do not reflect the district's demographic makeup. And, you know, a place for which this conversation has been ongoing for several years is from the clipping on the right in New York City, where the current schools Chancellor is commented a couple of weeks ago that the way admissions takes place at the city's elite high schools, schools like Stuyvesant, and Bronx science, where admissions is based on performance on a single test needs to change. And that's been something that has been a topic of conversation in New York for quite some time. And in this past year, we've seen a kind of renewed attention to issues of social justice, and equity. So these factors, the elimination of testing from COVID, in spring 2020, heightened concern for social justice. And also, some of the things that we're learning from higher ed about test based admissions policies have spurred many districts to at least think about in some districts to actually implement new systems, some on a temporary basis and some on a longer term basis. So on the higher ed side, you know, there is a lot of literature that performance on admissions tests like the PSAT or the ACT is strongly influenced by race, income and parental education, and for very much the same reasons that a COVID Created difficulties in taking and administering standardized tests in 2020. Many colleges and universities waived their standardized test requirements. So some numbers that I've seen on that about 60% of four year colleges and universities were test blind or test optional.
Now, in many of those colleges, we're still waiting to see what the policies will be for the coming admission cycle. But some public colleges and universities have gone farther with longer term changes. So in this respect, California is quite noteworthy. So California has a four year moratorium on requiring the SAT or ACT as part of admissions. Washington State, Oregon and Colorado have also made the SAT and ACT optional. And we're still waiting to see what the consequences of this will be. There is a quite lively academic debate about the effects of eliminating the LSAT and an ACT. Someone who's argued strongly for eliminating the LSAT in the Cal system is a colleague of ours, Jesse Rothstein, who's a professor at UC Berkeley. And he's made the claim that alternative measures like GPAs, and state based assessments may be more reliable than the SAT because the SAT is strongly influenced by preparation, okay? It's not necessarily aligned to state curricula. On the other hand, without a measure, like the SAT or ACT, schools may rely on things like essays or letters of recommendation. And earlier this week, we had a study released from folks at Stanford, showing that relying on essays actually may generate even more inequality. So much remains to be learned about whether the elimination of the SAT will actually be a force towards increasing equity or not something that many of us are paying attention to.
So let's go back to K-12. And let me tell you about what has happened in a couple of places. So one of the places that has made a pretty substantial change to admissions policies is Boston. So that's where I'm zooming from right now. In Boston, the city is home to three different testing schools, the most famous of which is the Boston Latin School. That's the oldest High School in America. It's a school that they joke was, you know, Harvard was created for the graduates of Boston, Latin. And for a long time, admissions to Boston, Latin School has been based on a combination of performance on a test that is ISEE, and also GPA. But this year, the Boston school committee eliminated the admissions exam, okay, this was a one year temporary policy, and they decided to base admissions on previous course grades. Earlier standardized test scores. So this is not the admissions exam for the school and a student's zip code. So this is the major new innovation. zip codes are to be ranked by median household income. And eligible students residing in the lowest income zip codes will be guaranteed a seat at their top choice. Okay, so this is an example of what we're seeing more and more of a placed based admissions policy where slots are rewarded based on a student's neighborhood of residents. And just last week, we're starting to see some facts about this in the media. This has changed diversity at Boston's exam schools. But some feel angry about not getting in capacities that were not changed in a dramatic way at these schools. So what do we know so far? So on the left, here, I'm showing you the racial makeup of seventh grade admissions, invitations to Boston Latin School. And on the right, I'm showing you what happened in this past admission cycle. Okay, so this is hot off the presses, literally, last week's newspaper. And what you see here is there was an increase in the number of black applicants who were admitted, a 14% increase, a 3% increase in Latinx admissions offers and a 16% decrease in white admissions offers and a 3% decrease in Asian admissions offers. Okay, so this is showing that the policy changed The racial makeup of offers at the Boston Latin School and the city is now thinking about what to do for the upcoming school year, keep this policy, think about other policies or go back to their old system.
The decision as far as I know, has not been made yet. One of the things that has been discussed in Boston is looking at what our friends in Chicago have done. So Chicago actually adopted an admission system based On neighborhood of residence several years ago, back in 2009. And in the Chicago system, the way it works is every single census tract is placed into one of four tiers, the tiers, one are the most disadvantaged according to the associate economic index. That index includes things like the homeownership rate and the track or the levels of education, the single headedness of families in their track. So group one or two, one is the lowest, most disadvantaged center census tract in Chicago. Group four, on the other hand, are considered the most advantaged according to this MCs index. And in Chicago's admission system, the way these neighborhood considerations play out, is shown on the right here, let's just focus on Northside the most selective of the schools in Chicago at Northside if I'm an applicant from tier one, so that's in blue here, the score that I need to qualify for admissions is about 100 points lower than if I'm an applicant from tier four, the more advantage tracks according to this index, okay. So this is how the place based affirmative action system plays out in Chicago, it affects what score you need to qualify for admissions based on where you live, okay. And by and large, there's about 100, or 80 to 100 point gap between the most disadvantaged and the most advantage neighborhoods, okay, and so, we've been studying this policy over the years, we're grateful to the cooperation of Chicago Public Schools, it's a pretty bold initiative, because they had just come out of a consent decree, and they decided to implement this play space policy. But you know, one of the things that we're starting to understand more and more is, in the design of systems like this, it's very important for us to think very carefully about what equitable access actually means. Okay, so I have some examples here from some of our research work, which I'm showing you mostly to get you thinking. Okay, so I have pairs of students who have applied to particular schools, and my first example, student A and student B have both applied to Walter Payton High School. Okay, so that's one of the most sought after schools, and I have the demographic attributes, both are Hispanic students. Neither qualifies for a free and reduced price lunch. In Chicago, there is this neighborhood component to assignment. But there's also a test based component, the test depends on your exam performance on the admissions exam, your performance on other standardized tests and your school grades, they come up with a composite score. And in our first example, we have a situation where student A has a composite score of 98.8 and is not admitted to Payton, whereas student B has a composite score that's 90.6, so considerably lower, and is admitted to Walter Payton.
So if we are to judge equity, based on race mix, income status, you might ask, is this this type of system that we want, where student B is getting in, and student A is not? Well, of course, the reason this has occurred is that the neighborhood that student B lives in is more disadvantaged in the neighborhood that student A lives in and even though both are Hispanic students who do not qualify for a free and reduced price lunch. Okay, so that's just one example. Let me do one other example here just to show you, let's look at students C, and D. So students C and D, are both black students who do not qualify for a free and reduced price lunch, okay. And the composite score of students C is a 98.8, whereas student D has an 89.3. Okay, so according to measures of disadvantage, race and free lunch status, students C and D are identical. But student D is getting an offer at Walter Payton, despite having 10 points lower composite score than student C. Okay. And here again, this is a consequence of the fact that the Chicago system is using a geographic proxy. It's using the neighborhood characteristic in determining placements. Okay, so there are lots of degrees of freedom here, and things to think about. Let me show you one more example. You know, these are just one off examples. Okay. I'm going to show you something a little bit more systematic in just a second. But I just want you to start thinking about what we mean by equitable access? How are we going to measure that what is the goal? And once we ask what the goal is, what is the best Way to implement that goal. So let's take a look at I and J. So I and J here my last one I promise, student I is a Hispanic student who does qualify for a free and reduced price lunch, and has a higher composite score a 97. Compared to student J, who does not qualify for free and reduced price lunch, okay. And in the place based affirmative action system here, student I is not getting an offer of Payton, whereas student J is getting an offer at Payton. So student I is eligible for free lunch and has a higher composite score, but does not get an offer, relative to student J.
Now, another way to look at this and to be a little bit more systematic, and this is based on some academic work that I've done with a colleague here, Glen Ellison is to ask the following hypothetical question, okay. Suppose we are to judge the performance of an admissions policy on how well it trades off the incoming scores of kids at a school. So that's your on the y axis and the figures relative to some measures of disadvantage. So on the x axis here on the left, I have the minority share. And the way to read this is the red triangle here is telling us under Chicago's current admissions policy, the average incoming score of a student getting an offer at Northside, okay, that's one of the other popular schools is about 97.6. And the average minority share of students at Northside is about 35%. Could we have designed a system that achieved that same level of incoming scores but had more diversity judged by minority share? And what this arrow here is showing is that if we helped fix the average composite score, it would have been possible to increase the minority share at Northside using a different admissions policy to 50%. Okay, so that's room for improvement if our only goal is to have a school be diverse, according to minority share. When we move vertically, we have a similar kind of exercise, let's say we hold fixed our target minority share, how much higher incoming students scores could we have gotten? Okay, so at about 35% minority, we could have had an average incoming score of almost 98.7. And so the room for movement, both vertically and horizontally is room for movement. In the admissions policy in the design of the admissions policy on the right, I'm doing the same kind of exercise where I say, let's define equitable access by looking at measures of low income, their free and reduced price lunch share, and their two weeks could have kept the incoming classes, scores fixed and had 60% of kids at Northside be free and reduced price lunch, had we designed a different policy. Now, of course, in Chicago, there's this consideration of geography. And that's a significant one. When we think about what does equitable access mean, the city's decided that we want to have representation across all of these different neighborhoods, and there's a trade off. Right, so the question that we need to think about is how best to implement policies to minimize how much we need to actually trade off across these different goals. Now, let me mention a couple of other districts that we talked to frequently and work with, and some of the things they're doing for those of you who don't know, so in New York City, there's been substantial changes that middle and high school this year middle schools did not use test scores or other academic screens to select students. At high school, the city eliminated district based admissions preference. So in some districts, some schools gave priority to pupils who resided in, in the district in some of the zip codes. And so there's a recent press article out about some of the effects of this. So Eleanor Roosevelt High School is a sought after school in the Upper East Side, because they eliminated this catchment area priority, the zip code base priority, the number of offers that went to students outside of the district jumped from 1%, all the way up to 62%. So that's, you know, a step towards the screening. And that's something that New York City did this year in San Francisco at Lowell High School. They got rid of their GPA and standardized test assessment admissions, criteria and they use an admissions lottery. Okay, this is something that was initially a temporary policy, but now has become a permanent policy. And then finally at Thomas Jefferson High School, another selective school in Northern Virginia. This year, they dropped teacher recommendations and standardized tests from admissions requirements. So you still need to submit an essay to be considered for tj. But there's no longer a standardized test. So we're starting to hear stories like this. These are some of the more well known schools across the country where people are thinking very carefully about changing admissions policies with COVID With emphasis coming from our renewed emphasis on social justice, there's a big opportunity to think about increasing equitable access, and I think one important implication for us is that when we talk about equitable access equity means different things to different people. Is this based on racial criteria, income criteria, geographic criteria. And I think it's very important for us to be precise on the goals that we had and what measures that we're targeting. Now there is a huge opportunity for us because some temporary decisions have been made permanent. But there's also an opportunity to think more carefully about policies that have been implemented. So, I've certainly had many wary phone calls from enrollment offices where, you know, we don't know whether the decisions that are made under these pressing timelines and unusual circumstances are the best possible ones, and we now have an opportunity to evaluate and consider alternatives, much like Boston is going to be doing this summer. So we need to think about what is the best way to advance equity. Now the simplest but maybe hardest answer is we should create more seats at schools that other people want that are most sought after. But that's often hard to do. So, should we tinker with admissions tests we move from standardized tests to other types of assessment should we get rid of them altogether like the local high school did. Should we get rid of other screens like geographic screening or open house priorities? Should we change the underlying lottery system, and you know, the approach that we recommend depends on the context and it depends on what the stakeholders in the community see as the desired outcome. But I would like to emphasize that if we could separate, you know, our goals from the implementation of those goals. I think we can design more effective policies. And in many cases, we don't know what will happen unless we actually try to simulate what will happen. And so that's something that I strongly encourage folks to consider doing as they undertake these types of policy reforms. So, let me wrap up here, thank you guys so much for your attention. And I love to open it up to any questions or comments from the broader group.
So, actually I see some questions here already. So there's one question here that's asking in Chicago system, free and reduced price lunch is a fairly crude measure of disadvantage. Is it possible that the neighborhood factors are actually picking up additional signals of disadvantage that don't show up in FRL. Granted, it's still a proxy but it's potentially a better one. That is a fantastic question and it gets at the heart of the issue.
So, what is the best way to measure disadvantage, right? So, one thing to note is, in some districts. All students are eligible for free and reduced price lunch, so it wouldn't be possible to use even that kind of measure. So certainly it is possible that the neighborhood factors picked up. You know some other notions of disadvantage and if that's what the city would like it's a worthy goal. You know one of the things that we've been seeing about Chicago system and any place based system I think that is challenging for the design of these policies is that the types of students who are actually, most likely to have a high enough score to qualify for pay in the north side actually so Tony Howard is saying all students in Chicago now receive a free lunch. Thank you, Tony.
So I say one of the things that makes the design of these kinds of systems quite challenging is, if I look at the characteristics of your neighborhood, and I have a kid who is talented and is doing really well in school, and is able to qualify for pay in Northside, Then, that kid is somehow unusual for his neighborhood right he's a very high scoring in the city wide basis so we unusual for his neighborhood. So if we try to proxy for how disadvantaged that kid is based on the neighborhood, you're going to be dealing with a lot of noise because the kids who are relevant for you know these high admission standards at those schools are going to be unrepresentative. And one way to see that actually is in Chicago. If you were to go back to the old system that actually had a race based quota. That's a system that most of us think would not be allowed legally right now in the United States, and you say, how well does Chicago's old system of racial quotas, so the system in place in 2008, 2009, do in terms of income diversity as measured by free and reduced price lunch status, compared to the new system in Chicago, where we have, you know this place based consideration. It turns out this was very surprising to me; the old system actually generated more income diversity than the new system. And so that's just a way of saying that the correlation between FRL where you live and your race is quite elaborate and involved so I would be skeptical whether these neighborhood factors in Chicago, are predicting, you know other measures of disadvantage that we can pick up I mean ideally, we could try to assemble information on parental income, or parental education levels and use those as part of admission systems. And that's something that I haven't seen down in many districts but that would be a way to more accurately target disadvantage.
So the next question here, how can districts partner with researchers and or state education organizations to get more complete data on family mobility and enrollment patterns especially in the early grades. That is a lovely question. And one of the things that I'm always frustrated about, as a researcher with COVID and this year is, you know some of this stuff I have to show you is, you know, a little bit indirect evidence so I'm showing you information from Google searches ... And we have a, we don't have an administrative data infrastructure that allows for us to measure these patterns once students have left the traditional public school district. So some of the enrollment facts that we'll get will be more refined and more rigorous once the school year is completed, look at actual headcount, look at measures of attendance, so on and so forth. You know there's always this issue, And we've heard this from a lot of our friends that you know measures of attendance this past year are quite noisy, but the question of our children actually leaving the city and going elsewhere or children leaving the public district and going to private school but still staying in a given city, something that's very challenging for us to crack because data systems don't exist and that's I think related to another.
Another question: What data do we have to support the idea that families are opting for private schools, Instead of public? This again is multi point anecdote because, by virtue of being a private school you're not subject to the same kind of data reporting requirements as traditional public schools. So, you know, we've heard from some sectors not, it's not all private schools but some private schools. I've seen boosts in enrollment. So that's, that's our best evidence there certainly nothing systematic is just too early to have a really rigorous view on that. And I think that's important because some of those decisions are sticky so if we imagine that the decline in pre K and K is caused by the family saying well, I don't want my kindergartner on Zoom school, and I can speak from experience my child was a kindergartener on Zoom schools I don't blame them. Let's just wait a year and then enroll, then maybe those families will come back to the traditional public schools and we don't need to worry so much about enrollment. On the other hand, if a family says I don't want my child in zoom school in kindergarten, And I instead will go to private school. Those decisions tend to stick. So barring large changes in the economic circumstances of a family. It may be hard for traditional public schools to attract the students back.
There's another question here about the composite score in Chicago's system so, Chicago, the map I showed you how Chicago's census tracts broken into four groups. The four groups are constructed based on a composite index that takes into account. Initially it was five factors and now we've got at least six factors. Those factors so off the top of my head, are things like the homeownership rate of the track, measures of the education level of the track. Measures of a single headedness of the measures of English language. Speaking as a primary language in the track. And the measure that they added in, and I can point you to some more details on this, we have actually a fair amount of research on this because this is a fascinating system. But the measure that they added after one year of this system is a measure of local area school performance. And none of these measures in Chicago include racial characteristics of the track. Okay, and, to my knowledge, that's still an open question. So the courts, I think, in its decision in 2007 said very clearly we should not use race as a factor in K-12 admissions.
Following the standard from the fall injury case. You know the standard being, if you tried everything else we could consider using race but that's something that a district would have to take on and what we know nothing about is, you can use the racial characteristics on the tract as part of an admission system. To my knowledge that none of the districts have done that. So Chicago is a fact based measure that doesn't include racial attributes.
Well, I think I'm almost at time so I'm really grateful for you guys logging in, I'm so thrilled to hear from you guys if you want to talk about any of these questions that came out during the talk in more detail, don't hesitate to reach out. We'll make these slides available that we're recording here, and we're going to try to do another webinar in about a month. And on that webinar. We're talking about best practices for K-12 students. And so the tentative date here is listed on the slides, the registration process will be very much like their webinar for today and be on the lookout for the announcement for this. If you want the slides for today's webinar, and thanks so much for logging in. And for those of you who are working in districts. Keep up the good work. This has been a tough year and I don't envy the position you've been in, but this is a great opportunity to think and reimagine the future. Thanks so much.
Promotional Materials